eqout
This program eqout provides a fast and easy way to summarize the estimation results of different models that are established by the equation object in EViews. It thus facilitates the convertion of equation-based estimates to a standard format suitable for inclusion in a scholarly publication.
Current eqout summarizes single-equation-based models well. Other models based on more than one equation such as the GARCH model cannot be well supported at present.
There was an Add-in (EqTabs) created in 2010, which has similar functions. However, eqout has more features. For example, based on eqout, you can generate different types of output tables; you can customize the equation names and variable names displayed in the output table; you can specify a table title for your estimation results.
Version
Current version: 1.0.2 (16.2KB)
Test Environment
EViews 13.
Basic Syntax
exec eqout(options) obj_name1 obj_name2 …
Default Outputs
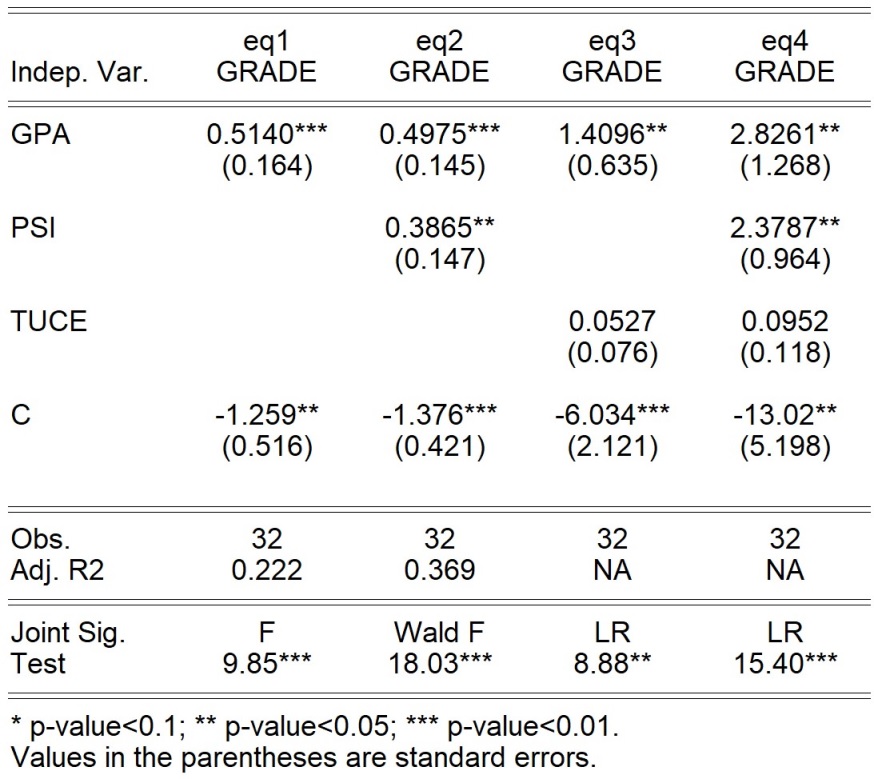
Default outputs are organized in a table, which includes the names of all equation objects behind eqout, the names of dependent and independent variables in the models, the coefficient estimates, the corresponding standard errors, the numbers of observations, the adjusted R-squared values (if exist), and the F/Wald F/LR/QLR statistics for testing joint significance (if exist). All estimates related the coefficient label “C” are placed at the bottom. If there is a coefficient label “SIGMASQ”, the associated estimates will be placed below “C”. Let’s have a quick look:
Options
- out=obj_name — Specify the name of output table object (default=eqoutput, or eqoutput1, or eqoutput2, …).
- tfmt=Integer — Specify the format of output table (from 1 to 6; default=1). The default format (or tfmt=2) may be better looking in EViews. The other four formats may be more suitable if you plan to copy the table to other editing environments such as Microsoft Word.
- vip=arg — Specify the types of values in parentheses under the reported coefficients: “se” (standard errors, default); “t” (t- or z- statistics for testing significance); “pv” (p-values).
- r2=arg — Report R-squared or pseudo R-squared values: “rp” (substitue for the adjuested R-sqaured values in the output table); “add” (add the R-squared values to the output table).
- cfmt=fmt — Specify the numeric format of reported coefficients (default=f=6.6). It will be passed to the string function
@strfor its fmt argument. If you want to change the default, please refer to the manual for the use of@str. - vipfmt=fmt — Specify the numeric format of reported values in parentheses (default=f.3). It will be passed to the string function
@strfor its fmt argument. - noy — Do not display the dependent variable in the output table.
- na=arg — Deal with NAs: “rm” (remove all NAs); “dash” (replace all NAs by “-“).
- title=string — Specify the title of the output table.
- lower — Change the names of all variables from UPPERCASE (default) to lowercase.
- aic — Report Akaike information criterions.
- sic — Report Schwarz information criterions.
- hqic — Report Hannan-Quinn information criterions.
- cn — Report the results or display error messages in Chinese.
- pcp=cutoff value — Report the percentage of correct prediction for binary choice models based on the specified cutoff value. Note that the value should belong to (0,1). If there is no binary choice model in the summarized models, the option will not work.
Replacing Names
eqout provides an easy way to change the reported equation or variable names. We can place the vertical bar “|” behind a name, and then place the new name behind “|”. To distinguish the equation names from the variable names. “@” needs to be placed between the two types of names. For example,
exec eqout obj_name1|new_obj_name1 … @ var_name1|new_var_name1 …
Examples
Open the workfile “binary.wf1” stored in the EViews installation directory (“.\Example Files\EV13 Manual Data\Chapter 31 – Discrete and Limited Dependent Variable Models”). We estimate four models and then use eqout:
'Classical regression model:
equation eq1.ls grade c gpa
'Regression model with robust standard errors:
equation eq2.ls(cov=white) grade c gpa psi
'Probit model:
equation eq3.binary grade c gpa tuce
'Logit model:
equation eq4.binary(d=l,cov=white) grade c gpa tuce psi
exec eqout eq1 eq2 eq3 eq4
These codes can generate the table displayed above. Now, we make some changes:
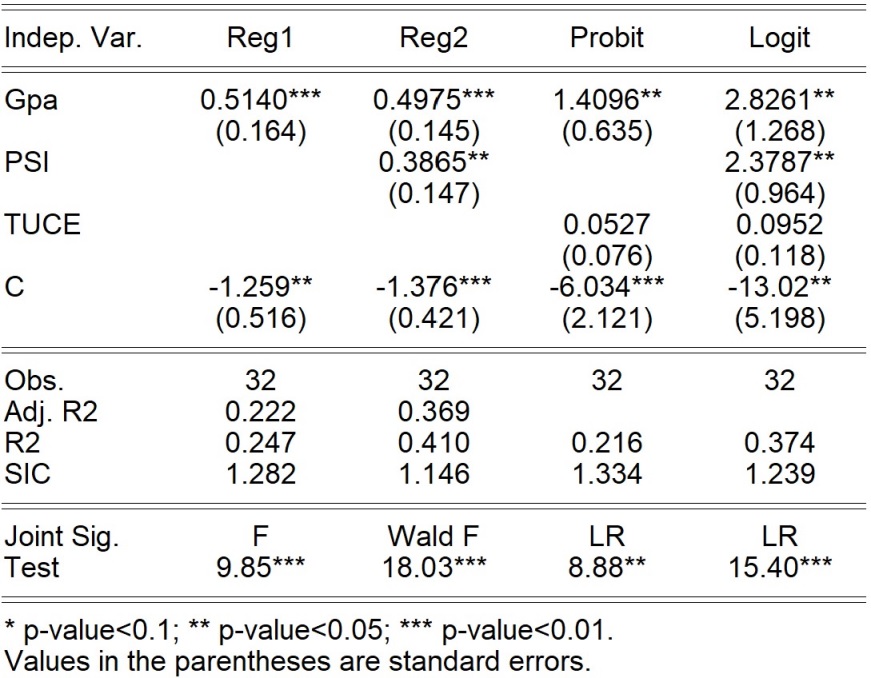
exec eqout(out=myout,sic,tfmt=2,na=rm,r2=add,noy) eq1|Reg1 eq2|Reg2 eq3|Probit eq4|Logit @ grade|Grade gpa|Gpa
show myout
'The codes above will generate a table titled "myout" to
'store the estimation results. Besides the default outputs,
'the table also contains the SIC and R-squared values. The
'table format is selected to be 2, which corresponds to a
'more compact table. All NAs in the table has been removed.
'The four equation names are replaced by "Reg1", "Reg2",
'"Probit", and "Logit" respectively. The variable name "GRADE"
'is replaced by "Grade" (since the option "noy" is used,
'"Grade" is not displayed here) and "GPA" is replaced by "Gpa".
The resulting new table is shown below:
Update History
- [April 3, 2022] Version 1.0.0.
- [October 17, 2022] Version 1.0.1. Updates: (a) the default for the option vip is changed to be “se” from “t” due to the argument in the Bruce Hansen’s econometrics textbook;(b) a new option pcp is added.
- [October 18, 2023] Version 1.0.2. Updates: (a) a new option noy is added; (b) summarizing ordered dependent variable models is supported; (c) some bugs are fixed.


- 版权声明:本作品使用知识共享(Creative Commons)的署名-非商业性使用-禁止演绎 4.0 国际许可协议。非商业转载请注明出处(作者及原文链接),商业转载请联系作者获得授权。

北京 海淀
13.9℃ 
博文+教程
阅读
给站长留言